
Intro
The Roosters and Knights arrive at Accor Stadium with season records of 18-9 and 17-10 respectively, so this is hardly a mismatch dressed up for Grand Final week. Their recent schedules have been broadly similar in difficulty, which makes the direct comparison especially useful. Sydney have produced the stronger attacking ceiling lately while Newcastle have shown they can stay competitive without dominating possession. The question for punters is whether that difference is large enough to justify the market gap.
The best price for Roosters is $1.45 with BetR, offering 1% better return than the average market price. The best price for Knights is $2.90 with PlayUp, offering 3.1% better return than the average market price.
Recent Form
The Roosters come in at 18-9 for the season and have scored 25.2 points per game across their past five, almost exactly in line with the league mean of 25.3. Their completion rate across that same span is 76%, below Newcastle's 77.4% and below the league mean of 77.9%. There is a clear range inside that Roosters figure. Their completion sank to 62% against the Rabbitohs in Round 27 before climbing to 85% against the Dolphins in Finals Week 3. That latest performance was paired with 36 points and gives the attack some momentum at the right time.
Margin
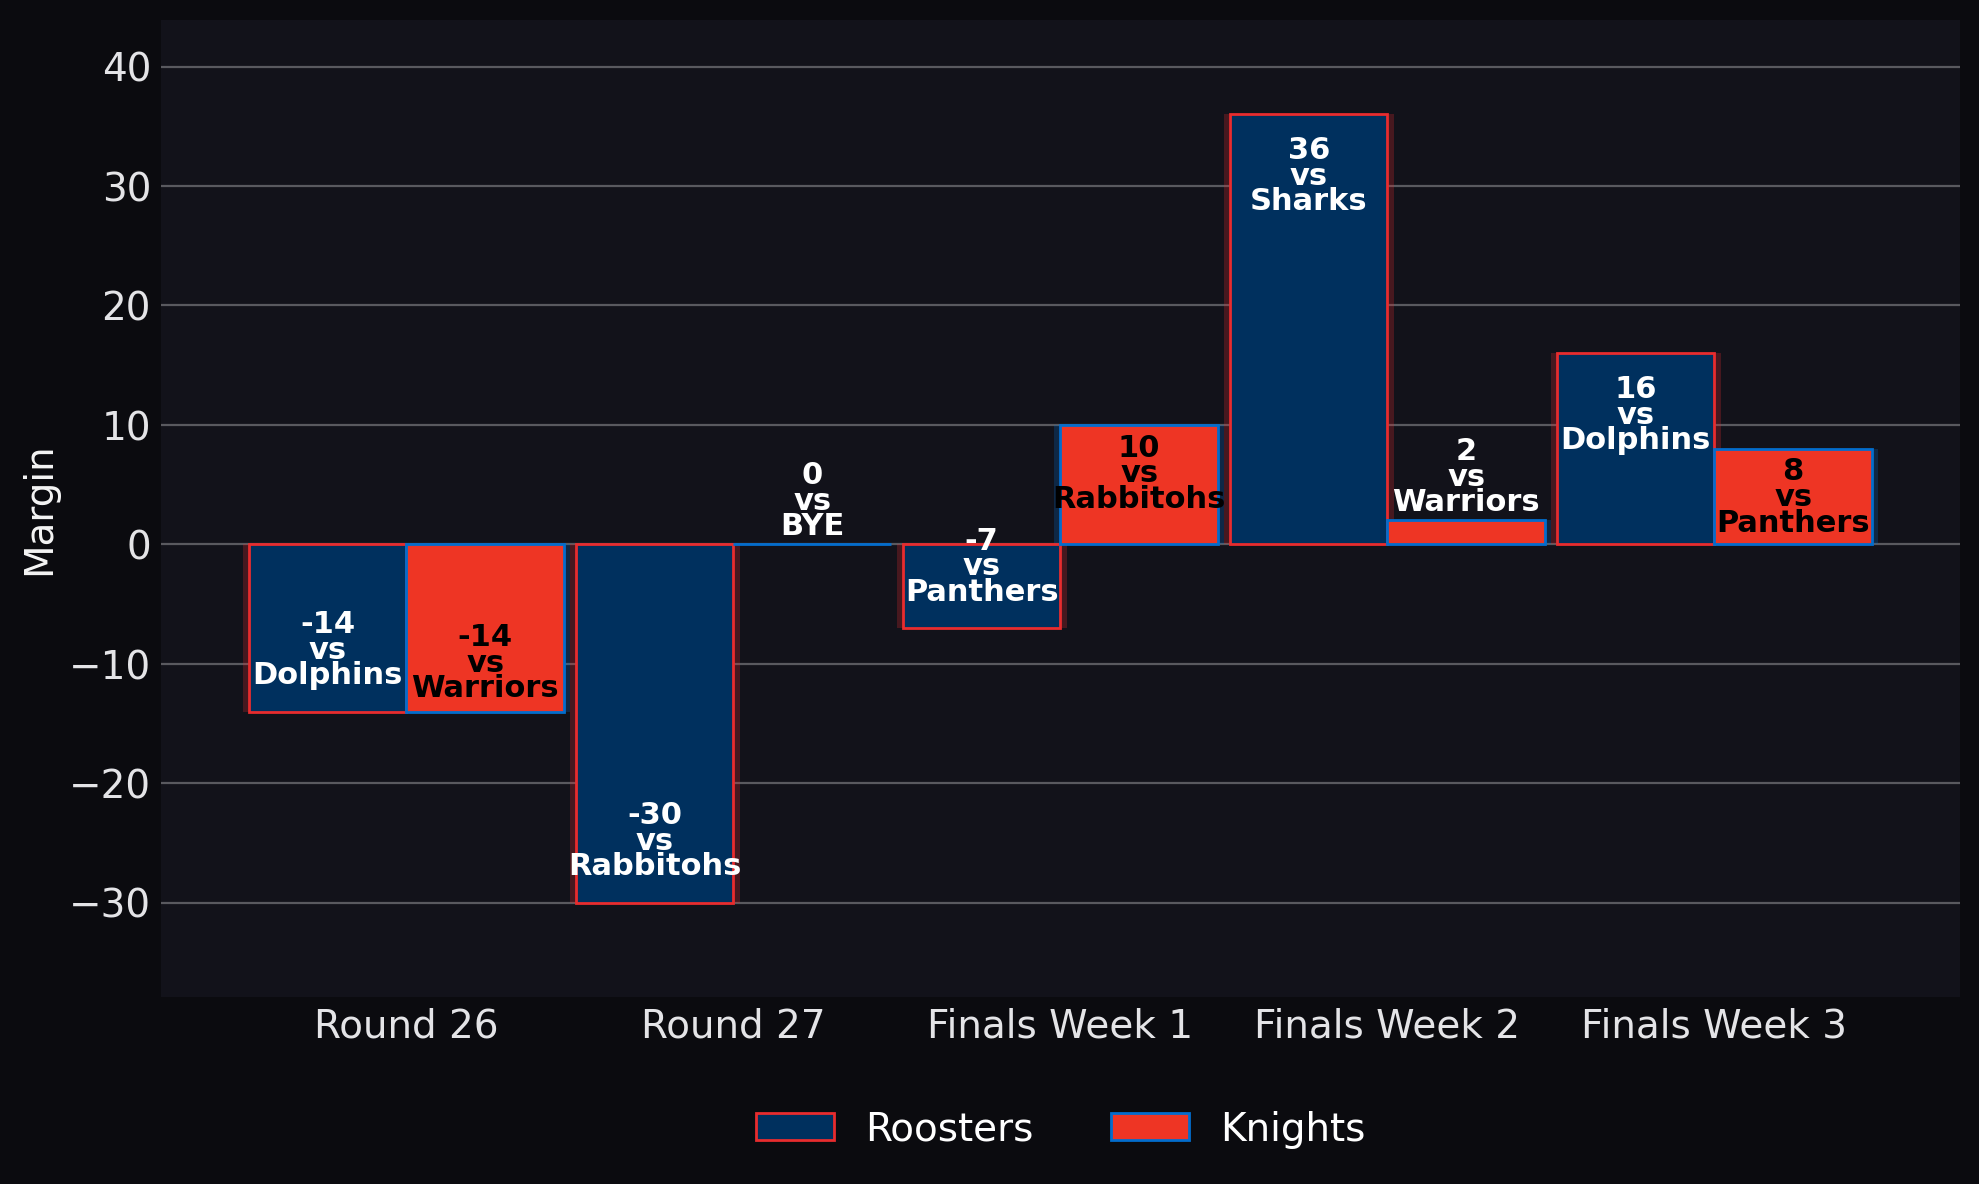
Margin combines scoring and defence into one number and anchors the recent form story.
Completion rate

The first recent form paragraph directly compares the Roosters at 76% with the Knights at 77.4% and the league benchmark.
Newcastle carry a 17-10 season record and have scored 22 points per game across their past five, which is 3.2 fewer than the Roosters and below the league mean of 25.3. Their run metres have reached 1570.8 per game during that stretch compared with the Roosters' recent average set distance of 40.3 metres and Newcastle's own 40.4 metres. The Knights also produced a sizeable 1839 run metres against the Rabbitohs in Finals Week 1, an obvious high point within the window. Their most recent outing against Penrith returned 1516 run metres, so the huge Finals Week 1 number should not be treated as their normal level.
Strengths & Weaknesses
The clearest Roosters attacking strength is their willingness to keep the ball alive. They have produced 10.4 offloads per game across the past five, far above the league mean of 6.9. That figure does come with a major outlier because they unloaded 23 times against the Dolphins in Round 26. Even with that caveat, their recent approach has been noticeably more expansive than Newcastle's available attacking numbers suggest. The Roosters have also made only 11.4 errors per game compared with Newcastle's 12, so Sydney have been slightly cleaner with possession while still creating second phase opportunities.
Offloads

The Roosters' 10.4 offloads per game are a major attacking characteristic and sit well above the league mean.
Defensively, the Roosters have missed 33 tackles per game across their past five compared with Newcastle's 39.8. Sydney's figure is also better than the league mean of 36, while Newcastle sit 3.8 misses above that benchmark. The Knights' average includes a rough 62 missed tackles against the Warriors in Finals Week 2, which is the major outlier, but the raw comparison still favours the Roosters. Newcastle have allowed opponents 5.8 line breaks per game across their past five compared with 5 for Roosters opponents, so the defensive concern does not stop at missed tackles. Both sides have averaged 0.2 sin bins across the same period, which effectively cancels out as a discipline separator.

Key Players
James Tedesco remains central to the Roosters attack, producing 1.6 line break assists per game across his past five appearances and 4.8 tackle busts per game over the same stretch. Robert Toia has supplied another direct threat from centre with 1.4 line breaks and 5.4 tackle busts per game across his past five. Toia has also scored 1 try per game over that window, one of the few individual try rates strong enough to demand attention. Spencer Leniu returns this week and has produced 20 post contact metres per game across his past five appearances, giving the interchange another source of direct yardage.
James Tedesco — Line break assists

Tedesco has produced 1.6 line break assists per game across his past five appearances and is a central creator for the Roosters. The league average is based on players in the same position and is calculated using recent performance data across the competition.
For Newcastle, Kalyn Ponga has averaged 151.2 run metres and 1.2 line breaks per game across his past five appearances, with his recent running output lifting to 189.3 metres per game across the latest three. Greg Marzhew has been even busier carrying the football, producing 180.4 run metres and 5.6 tackle busts per game across his past five. Bradman Best has added 141.6 run metres and 0.6 try assists per game over the same span. Fletcher Hunt returns this week and has averaged 78 run metres across his past five appearances, although his latest three recorded appearances produced no run metres.
Kalyn Ponga — Run metres

Ponga has averaged 151.2 run metres across his past five appearances and his running output has lifted recently. The league average is based on players in the same position and is calculated using recent performance data across the competition.
Tactical Outlook
The territorial numbers suggest neither side should expect an automatic field position advantage. Newcastle's average set distance of 40.4 metres across the past five is almost identical to the Roosters at 40.3 metres and both sit close to the league mean of 40.6. That effectively cancels out as a separator. The more important difference is what happens once the defensive line is engaged. Sydney's higher offload output gives them more ways to extend possessions, while Newcastle's 39.8 missed tackles per game leave them more exposed if the Roosters generate repeated second phase football. Newcastle can answer through Ponga, Marzhew and Best carrying strongly, but the Knights probably need to keep the contest controlled rather than let Sydney turn it into broken field chaos.
Average set distance

The tactical section shows the teams are almost identical at 40.3 and 40.4 metres per set.
Prediction & Value Bet
The Roosters look more likely to win because their recent attack has produced a higher scoring average, their defence has missed fewer tackles, and their capacity to create through offloads gives them another route when structured sets stall. Newcastle are good enough to make this uncomfortable, particularly with a 17-10 season record and several dangerous ball carriers, but their recent defensive numbers leave less room for error. We assess the Roosters at a fair 72% chance and Newcastle at 28%. The Roosters are $1.44 in the current market, which carries an authoritative market implied probability of 69.7%. The Knights are $2.81 in the current market, which carries an authoritative market implied probability of 35.6%. Our fair probability for Sydney sits above the market figure, giving the favourite some additional cushion compared with the odds. The tip is the Roosters to win and the recommended bet is Roosters head to head.
Check out other markets for this match: