RLWC match result · Round 2
Papua New Guinea 6–64 Samoa
Full time
Half time: 6–14
Final score, scoring summary and match statistics.
Papua New Guinea
vs
Samoa
- Competition
- Rugby League World Cup
- Date
- Venue
- Santos National Football Stadium, Port Moresby
How the score changed
Score and scoring events
Score progression
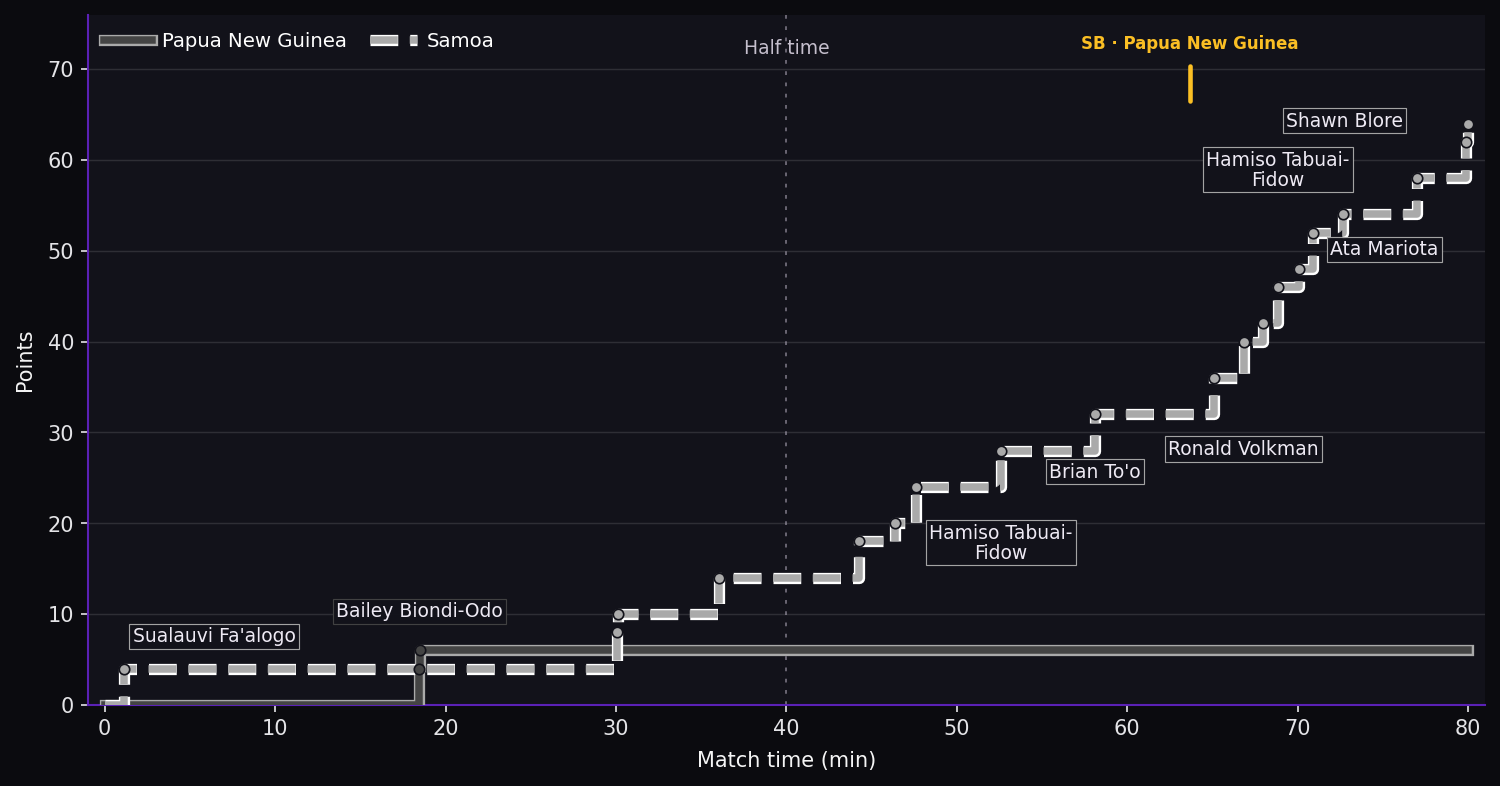
Papua New Guinea 6–64 Samoa at full time. Steps show the scoring events. SB marks a sin bin; SO marks a send-off.
Scoring events
- Try · Sualauvi Fa'alogoSamoa+4
- Try · Bailey Biondi-OdoPapua New Guinea+4
- Conversion · Rhyse MartinPapua New Guinea+2
- Try · Spencer LeniuSamoa+4
- Conversion · Stephen CrichtonSamoa+2
- Try · Stephen CrichtonSamoa+4
- Try · Sualauvi Fa'alogoSamoa+4
- Conversion · Chanel Harris-TavitaSamoa+2
- Try · Francis ManuleleuaSamoa+4
- Try · Hamiso Tabuai-FidowSamoa+4
- Try · Brian To'oSamoa+4
- Try · Shawn BloreSamoa+4
- Try · Ronald VolkmanSamoa+4
- Conversion · Chanel Harris-TavitaSamoa+2
- Try · Hamiso Tabuai-FidowSamoa+4
- Conversion · Ronald VolkmanSamoa+2
- Try · Izack TagoSamoa+4
- Conversion · Ronald VolkmanSamoa+2
- Try · Shawn BloreSamoa+4
- Try · Ata MariotaSamoa+4
- Conversion · Ronald VolkmanSamoa+2
Selected team comparisons
How the match was won
Run metres
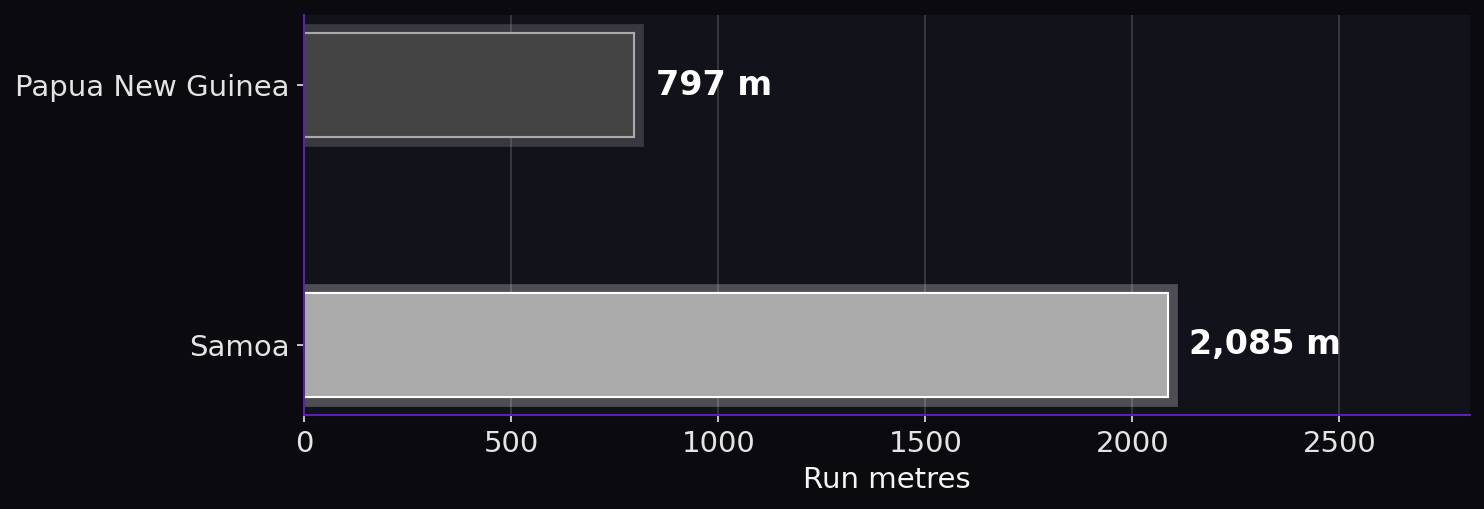
Papua New Guinea: 797 m; Samoa: 2,085 m.
Line breaks
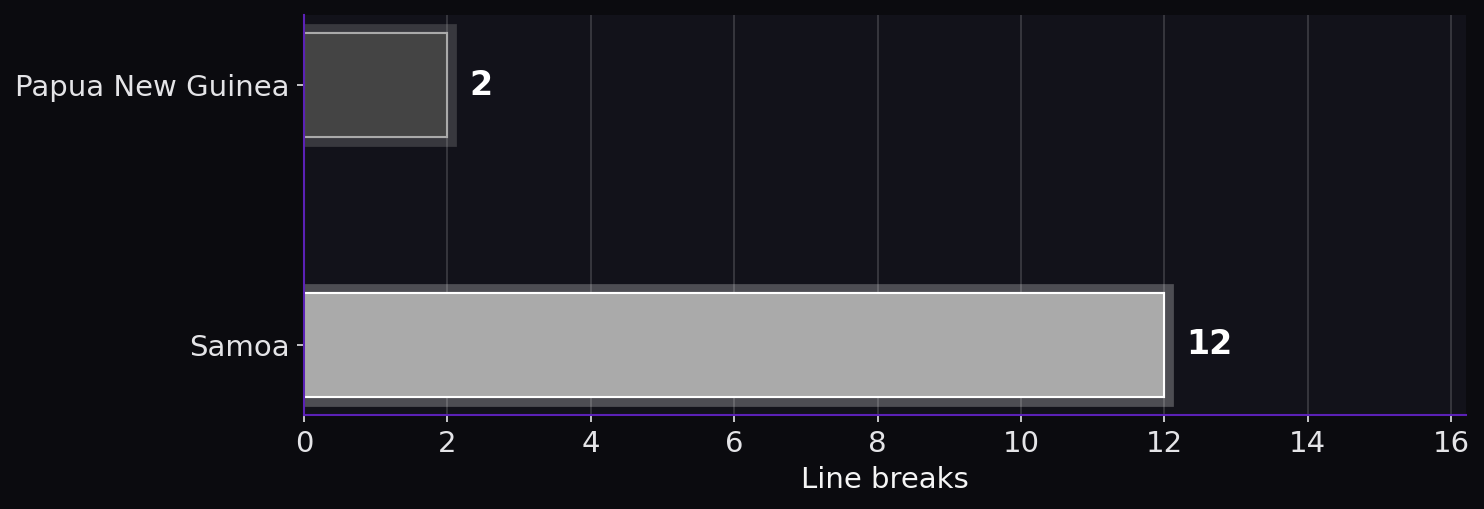
Papua New Guinea: 2; Samoa: 12.
Missed tackles
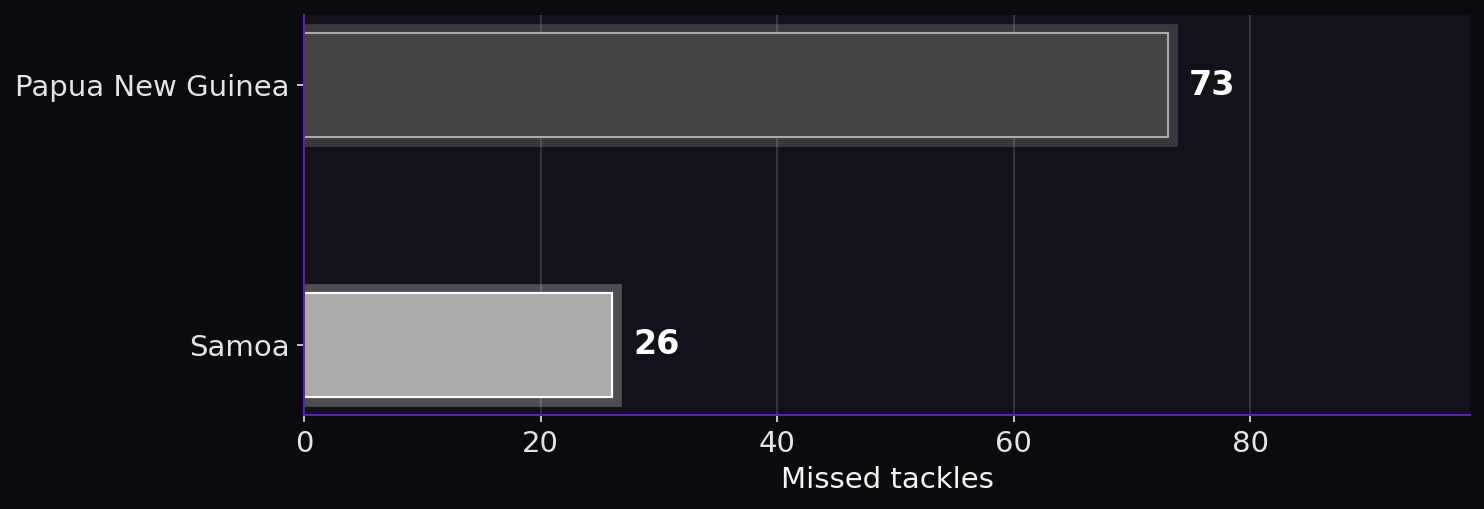
Papua New Guinea: 73; Samoa: 26.
Possession
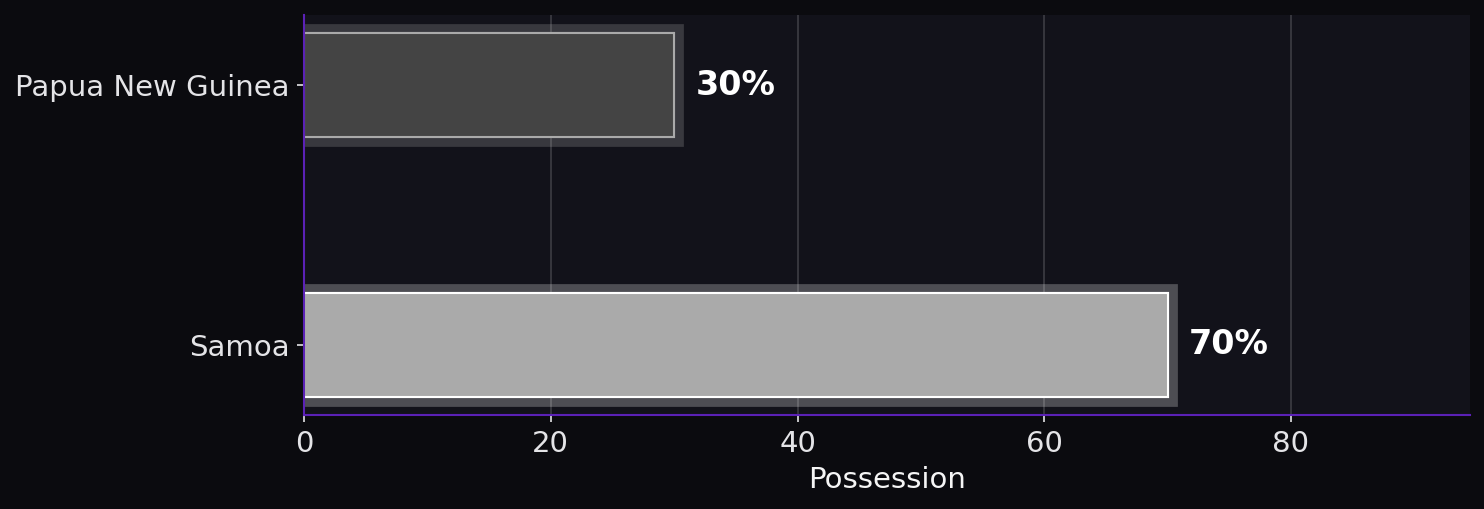
Papua New Guinea: 30%; Samoa: 70%.
Scoring timeline
Match flow
Line breaks by match period
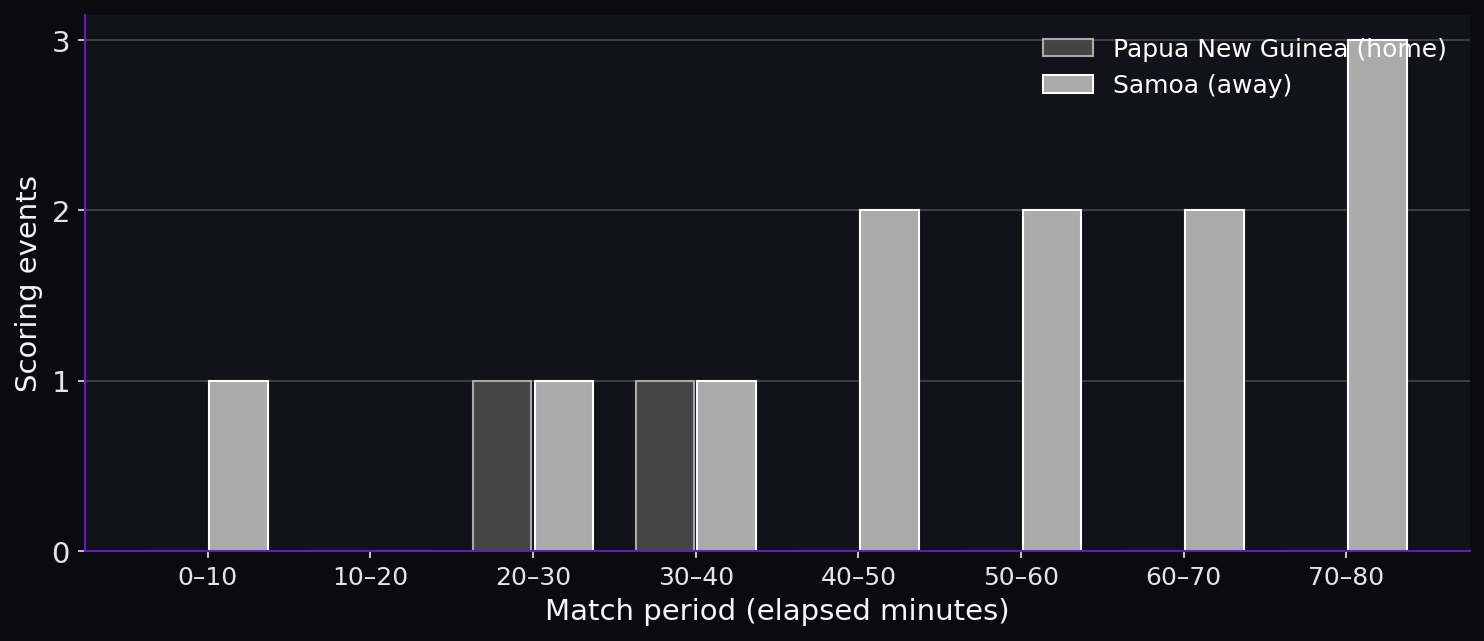
Scoring timeline.
The full match
Complete match statistics
Scoring
Scoring: Papua New Guinea and Samoa| Papua New Guinea | Statistic | Samoa |
|---|
| 6 | Points | 64 |
|---|
| 1 | Tries | 13 |
|---|
| 6 | Half-time points | 14 |
|---|
| 1 | Conversions | 6 |
|---|
| 1 | Goals made | 6 |
|---|
| 1 | Goal attempts | 13 |
|---|
Possession and control
Possession and control: Papua New Guinea and Samoa| Papua New Guinea | Statistic | Samoa |
|---|
| 30% | Possession | 70% |
|---|
| 75% | Completion rate | 79% |
|---|
| 3.68s | Play-the-ball speed | 3.83s |
|---|
| 10 | Errors | 10 |
|---|
| 18 | Sets completed | 34 |
|---|
| 24 | Sets attempted | 43 |
|---|
| 12:43 | Time in possession | 29:38 |
|---|
| 204 | Receipts | 449 |
|---|
| 109 | Passes | 251 |
|---|
| 6 | Dummy-half passes | 21 |
|---|
Yardage and territory
Yardage and territory: Papua New Guinea and Samoa| Papua New Guinea | Statistic | Samoa |
|---|
| 797 m | Run metres | 2,085 m |
|---|
| 231 m | Post-contact metres | 718 m |
|---|
| 33.21 | Average set distance | 48.5 |
|---|
| 66 m | Kick-return metres | 259 m |
|---|
| 82 | Runs | 195 |
|---|
Attacking penetration
Attacking penetration: Papua New Guinea and Samoa| Papua New Guinea | Statistic | Samoa |
|---|
| 2 | Line breaks | 12 |
|---|
| 26 | Tackle breaks | 73 |
|---|
Kicking
Kicking: Papua New Guinea and Samoa| Papua New Guinea | Statistic | Samoa |
|---|
| 50% | Kick defusal rate | 29% |
|---|
| 100% | Goal-kicking accuracy | 46.2% |
|---|
| 0 | Forced dropouts | 2 |
|---|
| 265 m | Kicking metres | 292 m |
|---|
| 10 | Kicks | 16 |
|---|
| 3 | Bombs | 7 |
|---|
| 2 | Grubbers | 3 |
|---|
| 0 | 40/20 kicks | 0 |
|---|
Creating chances
Creating chances: Papua New Guinea and Samoa| Papua New Guinea | Statistic | Samoa |
|---|
| 3 | Offloads | 26 |
|---|
Defence
Defence: Papua New Guinea and Samoa| Papua New Guinea | Statistic | Samoa |
|---|
| 312 | Tackles made | 164 |
|---|
| 73 | Missed tackles | 26 |
|---|
| 45 | Ineffective tackles | 5 |
|---|
| 72.6% | Tackle efficiency | 84.1% |
|---|
| 0 | Intercepts | 0 |
|---|
Discipline
Discipline: Papua New Guinea and Samoa| Papua New Guinea | Statistic | Samoa |
|---|
| 8 | Penalties conceded | 5 |
|---|
| 4 | Ruck infringements | 1 |
|---|
| 1 | Sin bins | 0 |
|---|
| 0 | Send-offs | 0 |
|---|
| 0 | On report | 1 |
|---|
Carry efficiency
Carry efficiency: Papua New Guinea and Samoa| Papua New Guinea | Statistic | Samoa |
|---|
| 9.7 | Metres per run | 10.7 |
|---|
| 6.9 | Pre-contact metres per run | 7.0 |
|---|
| 2.8 | Post-contact metres per run | 3.7 |
|---|
Tackle breaking
Tackle breaking: Papua New Guinea and Samoa| Papua New Guinea | Statistic | Samoa |
|---|
| 3.2 | Tackle breaks per 10 runs | 3.7 |
|---|
Scoring efficiency
Scoring efficiency: Papua New Guinea and Samoa| Papua New Guinea | Statistic | Samoa |
|---|
| 2.5 | Points per 10 sets | 14.9 |
|---|
| 0.50 | Tries per line break | 1.08 |
|---|
Penetration
Penetration: Papua New Guinea and Samoa| Papua New Guinea | Statistic | Samoa |
|---|
| 0.8 | Line breaks per 10 sets | 2.8 |
|---|
Ball security and pressure
Ball security and pressure: Papua New Guinea and Samoa| Papua New Guinea | Statistic | Samoa |
|---|
| 4.2 | Errors per 10 sets | 2.3 |
|---|
Defensive execution
Defensive execution: Papua New Guinea and Samoa| Papua New Guinea | Statistic | Samoa |
|---|
| 17.0% | Tackle miss rate | 13.3% |
|---|
Kicking pressure
Kicking pressure: Papua New Guinea and Samoa| Papua New Guinea | Statistic | Samoa |
|---|
| 0.0 | Forced dropouts per 10 kicks | 1.2 |
|---|
Second-phase play
Second-phase play: Papua New Guinea and Samoa| Papua New Guinea | Statistic | Samoa |
|---|
| 0.4 | Offloads per 10 runs | 1.3 |
|---|
Participation
Participation: Papua New Guinea and Samoa| Papua New Guinea | Statistic | Samoa |
|---|
| 4 | Interchanges used | 8 |
|---|
| 0 | Head injury assessments | 0 |
|---|